Ever typed something simple like:
int[] arr = {10, 20, 30};
int value = arr[1];
and just assumed the JVM magically knows where arr[1] is?
Well… it doesn’t magic it. There’s an entire memory system behind the scenes, and today, I’m going to take you inside the JVM to see exactly how arrays are stored, accessed, and managed. If you’ve ever wondered why arrays are fast but linked lists are slower, this post will make it crystal clear.
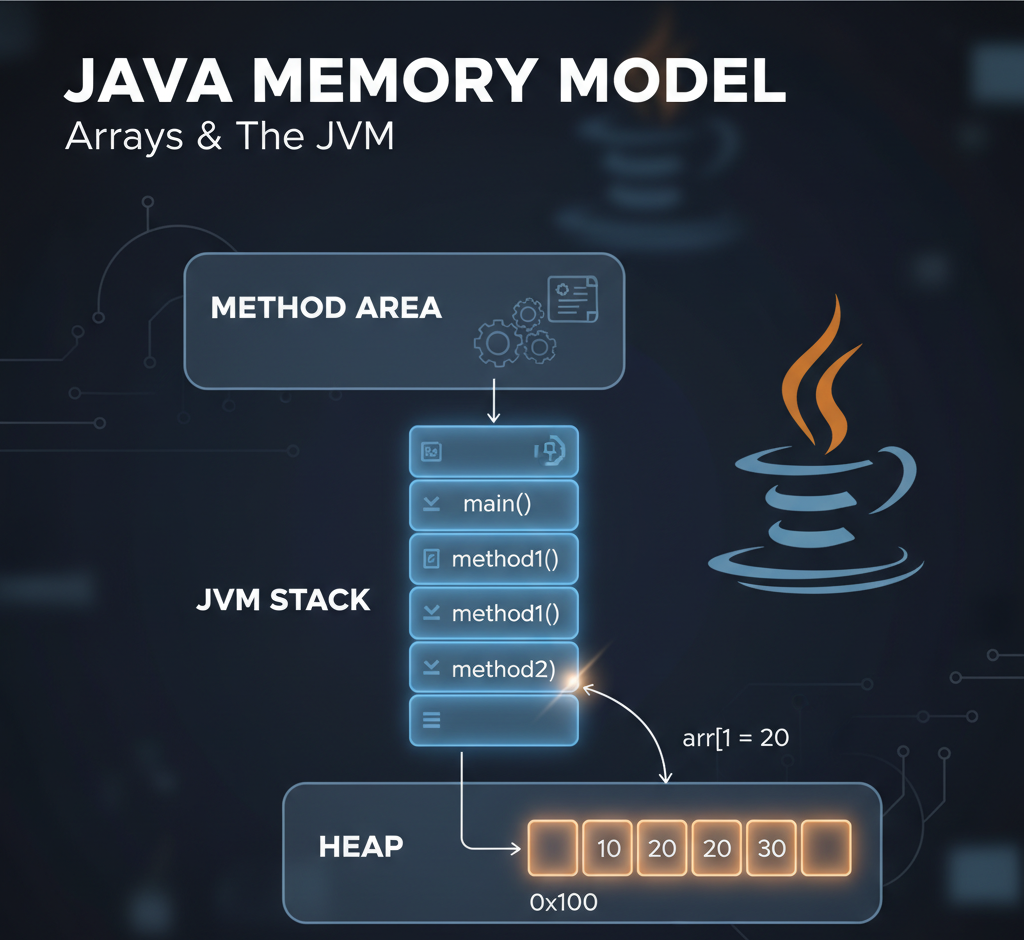
🏗️ A Quick Overview of the JVM Memory Model
Before we jump into arrays, let’s visualize how Java organizes memory:
+-------------------------+
| Method Area             |
|  → Class info, bytecode |
| Heap                    |
|  → Objects, arrays      |
| JVM Stack (per thread)  |
|  → Method frames, vars  |
+-------------------------+
- Method Area: Think of this as the “blueprints” of your program. It stores class info, static variables, and the bytecode for methods.
- Heap: This is where objects and arrays actually live. The heap is shared among all threads and managed by the Garbage Collector.
- JVM Stack: Each thread has its own stack. Every method call creates a stack frame, containing a local variable table and an operand stack for calculations.
🔹 Stack vs Heap: Who Holds What?
Let’s clarify the common confusion:
- Stack: Stores method-local variables and references to objects/arrays. Think of it as your desk — quick to access, cleared once the method ends.
- Heap: Stores the actual objects and arrays. Think of it as your filing cabinet — bigger and slower to access than your desk, but persistent.
So in our example:
int[] arr = {10, 20, 30};
- The array object
[10, 20, 30]lives in the heap. - The reference
arr(like an address) lives in the local variable table of the stack frame formain().
⚡ Step-by-Step: What Happens When main() Runs
1️⃣ JVM Creates a Stack Frame for main()
Stack Frame: main()
+---------------------------+
| Local Vars:               |
| [0] args                  |
| [1] arr → reference       |
| Operand Stack: empty      |
+---------------------------+
At the same time, the heap allocates memory for the array:
Heap:
0x100 → [10, 20, 30]
Here, 0x100 is just an example of the memory address JVM assigns to the array.
2️⃣ Accessing an Element: arr[1]
Java bytecode for this:
0: aload_1    // push arr reference
1: iconst_1   // push index 1
2: iaload     // load int from array at index
3: istore_2   // store in local variable 2
Step-by-step Execution
Step 1: aload_1
- Pushes array reference (0x100) onto the operand stack.
Operand Stack → [ 0x100 ]
Step 2: iconst_1
- Pushes index 1 onto the stack.
Operand Stack → [ 0x100, 1 ]
Step 3: iaload
- Pops index and reference, calculates the actual memory location in the heap:
address = base_address + (index * element_size)
        = 0x100 + (1 * 4)
        = 0x104
- Fetches value
20and pushes it back onto the stack.
Operand Stack → [ 20 ]
Step 4: istore_2
- Stores
20in local variable slot 2.
Local Vars:
[0] args
[1] arr → 0x100
[2] value = 20
Operand Stack: empty
✅ Key Insight: The value is loaded from the heap, but the operand stack handles the computation.
🔹 Why Arrays Are Fast, LinkedLists Are Slower
- Arrays are contiguous in memory. The JVM can calculate the exact address for any index using
base_address + index * element_size. - LinkedLists, on the other hand, store each element in a separate node with a reference to the next node. To access
node[2], JVM must traverse the nodes sequentially — no direct calculation possible.
Node1 → Node2 → Node3
 10       20      30
Hence, array access is O(1), while linked list access is O(n).
🔹 Memory Snapshot (During Execution)
+---------------- JVM Stack ----------------+
| Local Vars:                             |
| [0] args                                |
| [1] arr → 0x100                         |
| [2] value = 20                           |
| Operand Stack: empty                     |
+-----------------------------------------+

+---------------- JVM Heap ----------------+
| 0x100 → [10, 20, 30]                     |
+-----------------------------------------+

+---------------- Method Area -------------+
| Classes, bytecode, static variables     |
+-----------------------------------------+
🔑 Key Takeaways
- JVM separates stack and heap clearly: stack holds references, heap holds actual objects.
- Arrays are stored contiguously, which is why index access is lightning fast.
- Stack frames are created per method call and destroyed when the method returns.
- Understanding the JVM memory model helps you write efficient, memory-friendly code.
By visualizing stack frames, operand stacks, and heap memory, you can now understand exactly what happens when Java executes even the simplest array access. No more magic — just precise memory calculations!
Suggested Next Steps for Readers
- Experiment with
javap -c YourClassto see bytecode for your own programs. - Compare
ArrayListvsLinkedListmemory behavior. - Dive deeper into JVM garbage collection and object lifetimes.


Leave a Reply